Hi all,
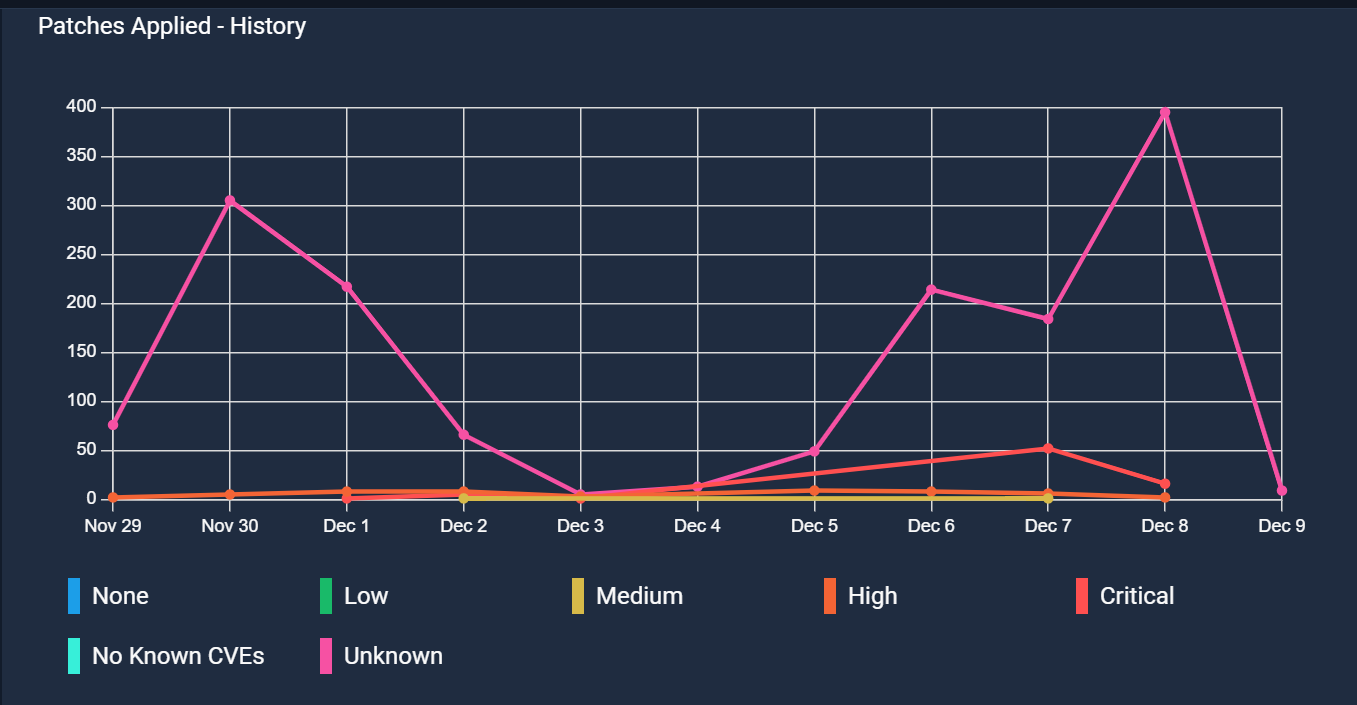
I would like to ask if there are any ways to extract the historical data to create the line graph as shown where the patches applied are shown in a monthly basis
This graph is under Reports > Overview Report

Thanks,
bigJohn
Hi all,
I would like to ask if there are any ways to extract the historical data to create the line graph as shown where the patches applied are shown in a monthly basis
This graph is under Reports > Overview Report

Thanks,
bigJohn
No account yet? Create an account
Enter your E-mail address. We'll send you an e-mail with instructions to reset your password.